


What is the value of cycling?🍋
An avid cyclist explores the economics of cycling in New Zealand

Cycling and cycle lanes in particular have been the subject of some controversy lately. As an avid cyclist, I thought I’d take a look at what we know about the benefits.
A 2023 Australian study by EY puts the value of cycling at a staggering A$18.6b, so I thought it was worth taking a closer look at how they came up with that number, and how New Zealand might compare. About A$17.6b of that is the economic contribution of cycling and e-scooters, with another A$0.954b of health and social benefits. Let’s start with the contribution to economic activity.
Cycling’s contribution to economic activity
Like a lot of economic studies, the EY methodology is clearly designed to create an impressive number. The headline total uses an estimate of gross (total) spending as opposed to value added. In other words, this total includes money spent on importing cycling goods, despite such spending not generating value to the local economy.
The headline number calculation then uses input-output tables to multiply that spending through the economy, creating an estimate of total indirect spending as a result of cycling. In the detail the study concedes that: “direct value add is commonly put forward as the most appropriate measure of the relative contribution of an industry to the economy.” They are correct — so we’ll stick to the direct value-add figures here.

The estimate of direct value-added for Australia is A$3.525b for cycling and A$0.159b for e-scooters; a total of A$3.684b (the total direct spend was A$6.947b). This figure is mainly made of sales of cycles, cycle related purchases and tourism. Given New Zealand’s population is 19.8% of Australia’s and our GDP is 14.6%, that would put our likely value between $537-729m.
Do we have any data that could improve on this estimate?
While we don’t have detailed data on all cycling-related purchases in New Zealand, we do have cycle and e-scooter sales figures. Statistics NZ publishes both the number and value of imported bicycles and electric micro-transport devices (largely comprised of e-bikes). Of particular note here are the rapid increases in e-bike sales. Volume of sales has risen by almost 300% and spending has risen by almost 600% in the last five years. For comparison over the same time period the value of car sales rose about 30%. Given the sharp drop off in electric vehicle imports since the removal of the feebate scheme, this means that e-bikes appear to be the fastest growing category of transport in the country.
Despite being their poorer cousin, cycle sales compare favourably with Australia. In fact, we buy similar numbers per capita as they do. For the total sales value we have to add a markup; NZTA assumes this is 40%. I sense-checked this with bicycle retailers in Wellington and they thought to be a little on the high side. So, to be conservative, I’ve used a 35% markup for conventional bicycles and 25% for electric and e-scooters. This gives a total spend of $392m. Even with the more conservative mark-up, our spending per person is slightly higher than Australia, which is probably a result of our weaker currency. Australia’s total cycle-related purchases (excluding tourism which we will come to below) were about 2.7 times the spending on cycles alone. Assuming this result holds in New Zealand the gross cycling-related spend would be $1.069b.
The other major component of the Australian analysis by EY is a figure for cycle tourism. Given the relative importance of tourism to New Zealand’s economy this is less likely to follow the same per capita spending trend and is worth separating out. The MBIE work on the economic benefits of the Great Rides put the spending in regional economies as a result of cycle journeys (food, transport, accommodation) at $951m. This analysis was undertaken in 2020/21 so cycleway use was likely disrupted by Covid (when tourism was mostly domestic). Given this context there is uncertainty around these numbers but overall they are likely to be conservative as the Great Rides network covers only a portion of total cycle tourism. When updated for inflation the total spend on cycle tourism is $1.16b. As predicted, this compares favourably on a per capita basis with the Australian total of A$1.885b.
Together, this suggests a total direct spending of $2.229b on cycling and e-scooters in New Zealand. Thanks to the impact of tourism this is much higher per capita than Australia. Assuming the same ratio of value added to total spend applies here as in the Australian study, the value-added portion of this is $1.182b.
Cycling’s contribution to health
The Australian study put the health benefit of cycling at A$954m, made up of:
avoided healthcare costs — A$313m
productivity benefits — A$540m
value of life years gained — A$101m
New Zealand estimates of the health benefits are considerably higher per capita. According to the Domestic Transport Cost and Charges (DTCC) study, cycling generates an average health benefit of $1.51 per kilometre travelled. With around 436 million km of travel by bicycle every year, this adds up to a total benefit of $658m.
In large part this difference will be due to the value of a saved life that is used in each country. New Zealand’s value is over twice that used in Australia, even accounting for differences in the value of the currency. Here in New Zealand there are valid questions over how appropriate it is to use the value of a saved life more broadly than the use it was designed for; namely in reducing the road toll.1 However, there is currently no better alternative.
Even accounting for this, there are still differences in the size of figures beyond what we would expect given comparable cycling levels in the two countries. This is likely due to methodological differences. The Australian study only counts the health benefits when cycling is crucial to an individual meeting their recommended daily or weekly exercise guidelines. The New Zealand methodology applies a simple average benefit per km travelled.
It is beyond my capacity to ascertain which methodology best stands up to scrutiny. On face value we should expect declining marginal returns to exercise, which suggests the Australian approach is more valid. However, the idea that exercise only has benefits in such limited circumstances seems overly conservative. Also, New Zealand’s estimates already take some account of diminishing marginal returns to exercise: In the monetised costs and benefits manual, NZTA estimated the marginal benefit of encouraging an otherwise sedentary person to take up cycling. This estimate is even higher; $4.90 per km of cycling on a conventional bike, and $2.50 per km of cycling on an e-bike.
Reduced costs (benefits) arising from cycling as a mode choice
The DTCC study highlights a few other benefits arising from cycling as a mode choice that the Australian study doesn’t pick up, including personal travel cost savings and benefits to other road users/ society.
These numbers are based on the long term average per km cost of travel, comparing the cost of travel by bicycle with the cost of travel in a private passenger vehicle (assuming average occupancy). This assumes that the journey has value and that the alternative – if a bicycle wasn’t used – would be to use a private car to make the same journey. Given that 90% of trip km are taken by this mode, this seems a reasonable counterfactual. However, it is worth noting that a more sophisticated analysis would take account of all modes.
The numbers are long term average costs in that the cost of asset ownership is averaged over all trips using that mode. The difference between the two is a reduced cost (or benefit) due to cycling as a mode choice. Given that these are “average” costs and bicycles are more likely to be used in congested urban environments with expensive parking, they are likely to be an underestimate of the total savings of using a bicycle.
The table below sets out the cost estimates per km for cars and bicycles, the savings per km accrued by bicycles, and the total monetary value of these savings each year.2
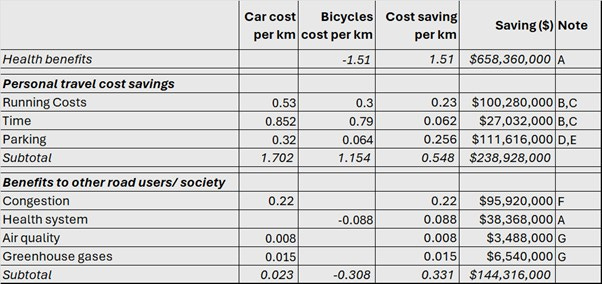
This is derived by multiplying the cost saving per km by the total number of km travelled by bicycles. According to the Household Travel Survey the average distance travelled by bicycle between 2020-23 was 436m km per year, made over 102m legs (or 4.27km per trip leg).
Big numbers like savings of millions of dollars can come across as hypothetical. A more tangible number for people to grasp might be the savings that each person makes by cycling. Given that the average leg is 4.27km, the average return trip by bicycle saves around $4.70. Assuming that a person working a standard five day week makes 80% of their commutes by bicycle then that person would save $855 per year. The health benefits are about triple that figure; while that might not directly save people money it could displace the need to spend between $800-1,700 on a gym membership.
Summary
As a quick recap we have the following estimates for NZ:
economic value-add (GDP) attributable to cycling (cycles, cycle-related spend, tourism) — $1,182m
health benefits from cycling — $658m
personal travel-cost savings (lower operating and parking costs, faster journeys) — $239m
Benefits to other road users/society from cycling (mostly reduced congestion) — $144m
As we have seen with the Australian EY study there is a tendency to use this sort of analysis to come up with a big, attention-grabbing number. I don’t intend to recreate that here, but I will note a couple of points for those that might wish to.
First, as I have noted, cycling has multiple benefits. Many of these are impossible to value.
Second, those that can be valued don’t always make sense to sum into one figure. This is because the values are based on different perspectives of who benefits from cycling. In particular, it is counterintuitive to combine cycling’s contribution to economic activity with the personal cost savings from cycling. This is because the benefits in one category (cycle and cycle related spending, number 1 above) become a cost in the other (personal cost savings, number 3 above).
Third, the remaining figures (health and benefits to other road users/ society, number 2 and 4 above) are externalities from cycling as a mode choice, which could conceivably be added to either number. While the health estimates may be uncertain, given that not all benefits of cycling are captured the overall figure seems unlikely to be an overestimate of the total value generated.

Concluding thoughts for future analysis
This is by no means a comprehensive analysis of the costs and benefits of cycling. Many of the benefits in particular are likely to be missing and could only be captured by, for example, sophisticated survey techniques. However, a few interesting points in the analysis could point to further work.
One is that 98.5% of cycle trail users at the time of this analysis were New Zealanders, presumably due to Covid reducing international tourism during that period. Given its tourism benefits, the value of cycling to the users must extend past the direct cost savings.
A second point is that this result is indicative of a significant “consumer surplus” from the act of cycling. For example, this could include the health benefits. An estimate of this consumer surplus could be estimated via a willingness to pay survey for cyclists (particularly when they can do so safely).
My final point is the meteoric rise in sales of e-bikes and other micro-mobility in recent years. This is a trend worth watching closely, and one that could potentially transform the way Kiwis travel.
This work was undertaken in my private capacity. With thanks to Caroline Shaw and Stu Donovan who offered comments and helped me navigate the murky depths of the DTCC study. All errors are my own!

The question here is whether people are consistent in their preferences for spending to prevent deaths across all causes of death? Our approach to public health as a society would suggest not. See The economics of saving lives.
Negative costs are benefits. I’ve included the health numbers for completeness as they also come from DTCC. My data sources are listed in the “notes” column: A, B, C, D, E, F & G. Cyclists generally do not pay for parking however they do take up space. In order to be conservative, I have assumed that bicycles cost 1/5 the amount to park as a car.
 |
|
I would love to see a study of the costs, particularly the cost to taxpayer's of hire scooters in our larger cities where riders seem to zip along the pavement in the midst of pedestrians, helmetless and causing injury to themselves and others.
My own ebike has been invaluable in helping me retain some fitness.