Members firmly support NZ emissions trading scheme (ETS)
Reporting back on NZAE member survey #3
NZAE Member Survey #3 asked three questions, all on aspects of the NZ emissions trading scheme (ETS). Respondents were also asked to rate their level of confidence in their answers. I used these ratings to weight answers.1 The bar charts show both weighted and unweighted results, while numbers in the text refer to unweighted results.
Overall, respondents showed strong and consistent support for the ETS as the centerpiece of NZ’s climate change response.
New Zealand’s ETS differs in important respects from those of other countries, so these results are not necessarily applicable to other countries’ schemes.2
Survey details
The members’ survey was circulated to NZAE members on September 5th and was open until September 9th. Forty-five members answered the survey — 84% were male, and 44% held a PhD. Respondents were equally split between academia, government and “other”. Roughly half were over 50 years old.
The survey reused the questions asked in March 2022 of a panel of economic experts — the NZ Expert Survey (NZEES). Asking the same questions allows us to compare the responses of members with those of the smaller expert panel.
Q1 The ETS vs alternative policies
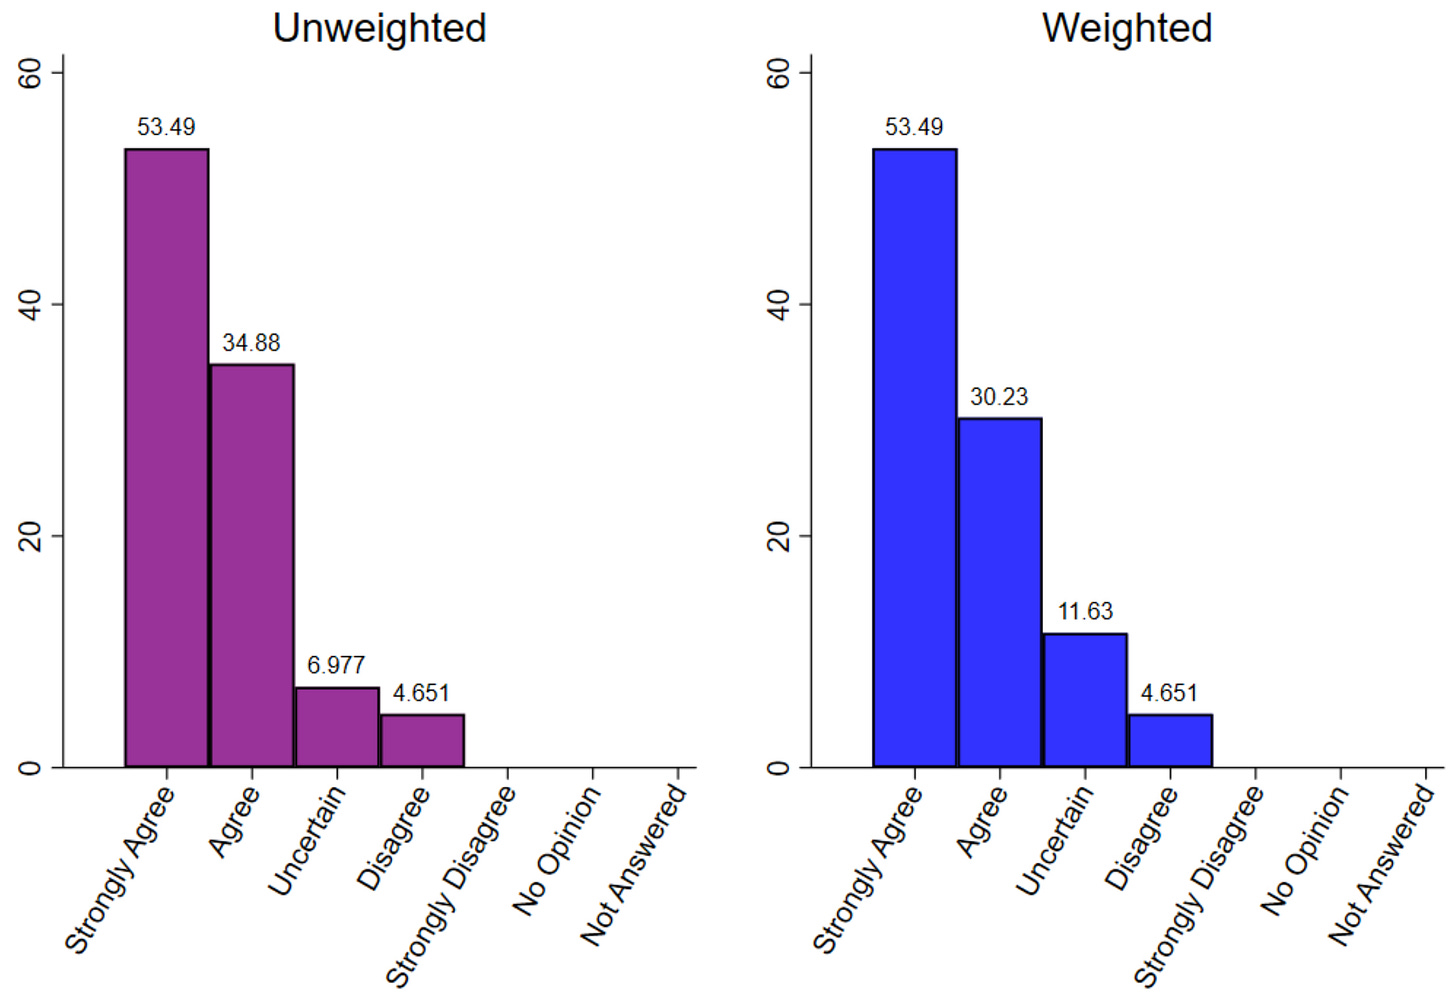
Tightening the Emissions Trading Scheme’s cap on net emissions would be a less expensive way to reduce carbon-dioxide emissions than a collection of policies, such as fuel economy standards for imported vehicles, that target emissions already covered by the ETS.
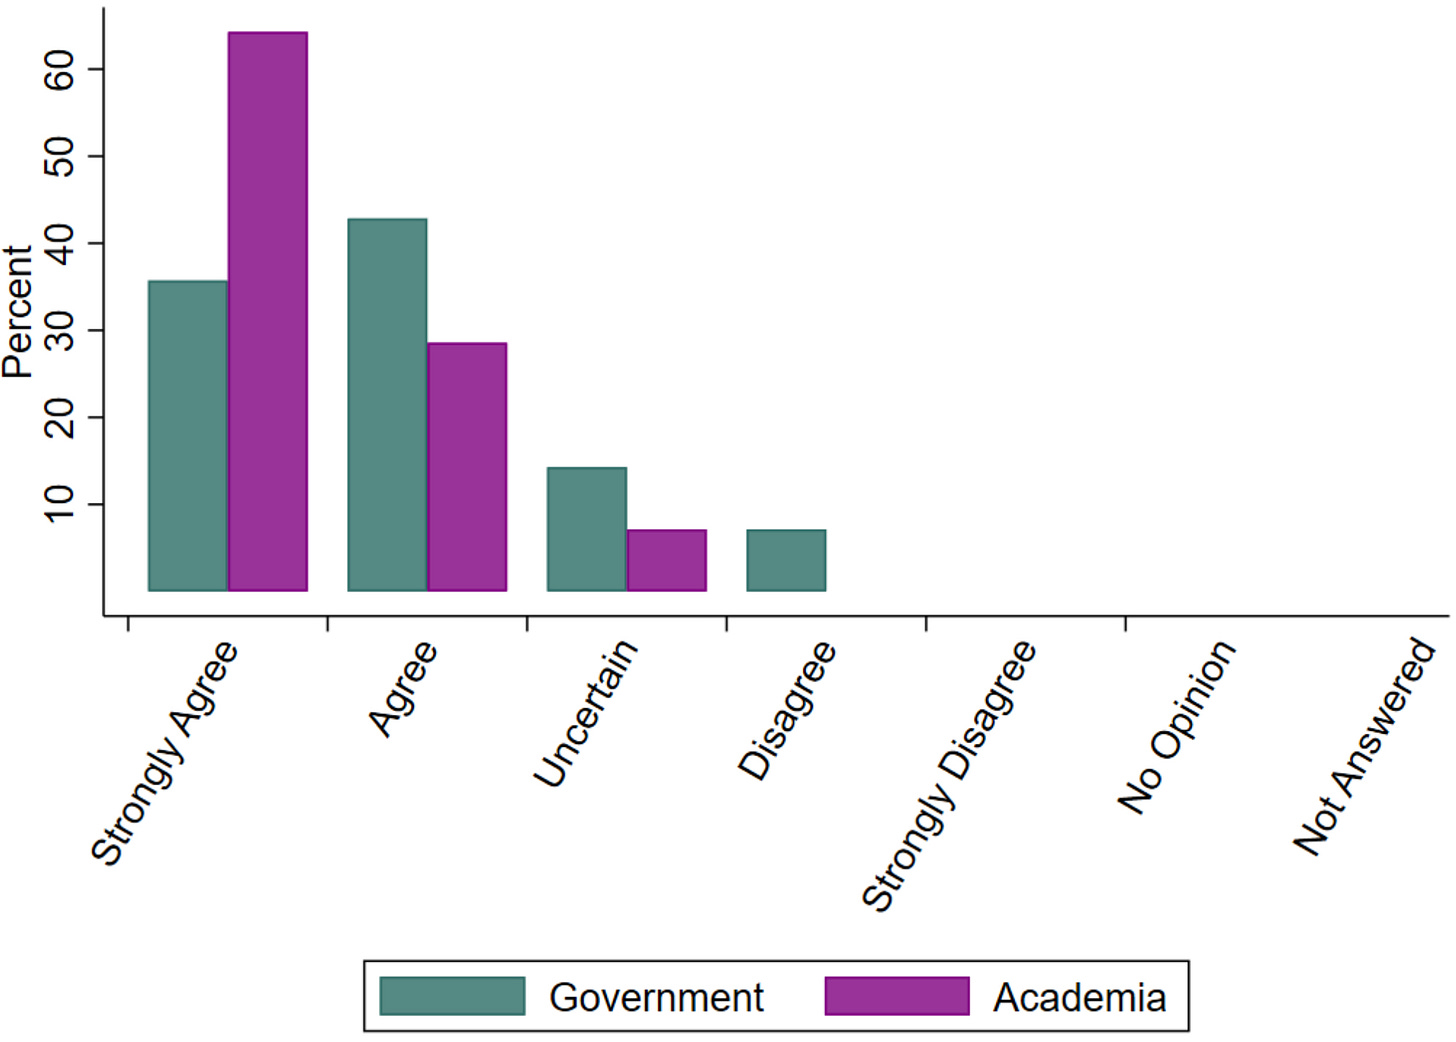
The majority of respondents strongly agreed (53%) or agreed (35%). Just 5% (i.e. 2 respondents) disagreed. Members’ response is somewhat more extreme than the expert panel, of whom 31% strongly agreed and 54% agreed.
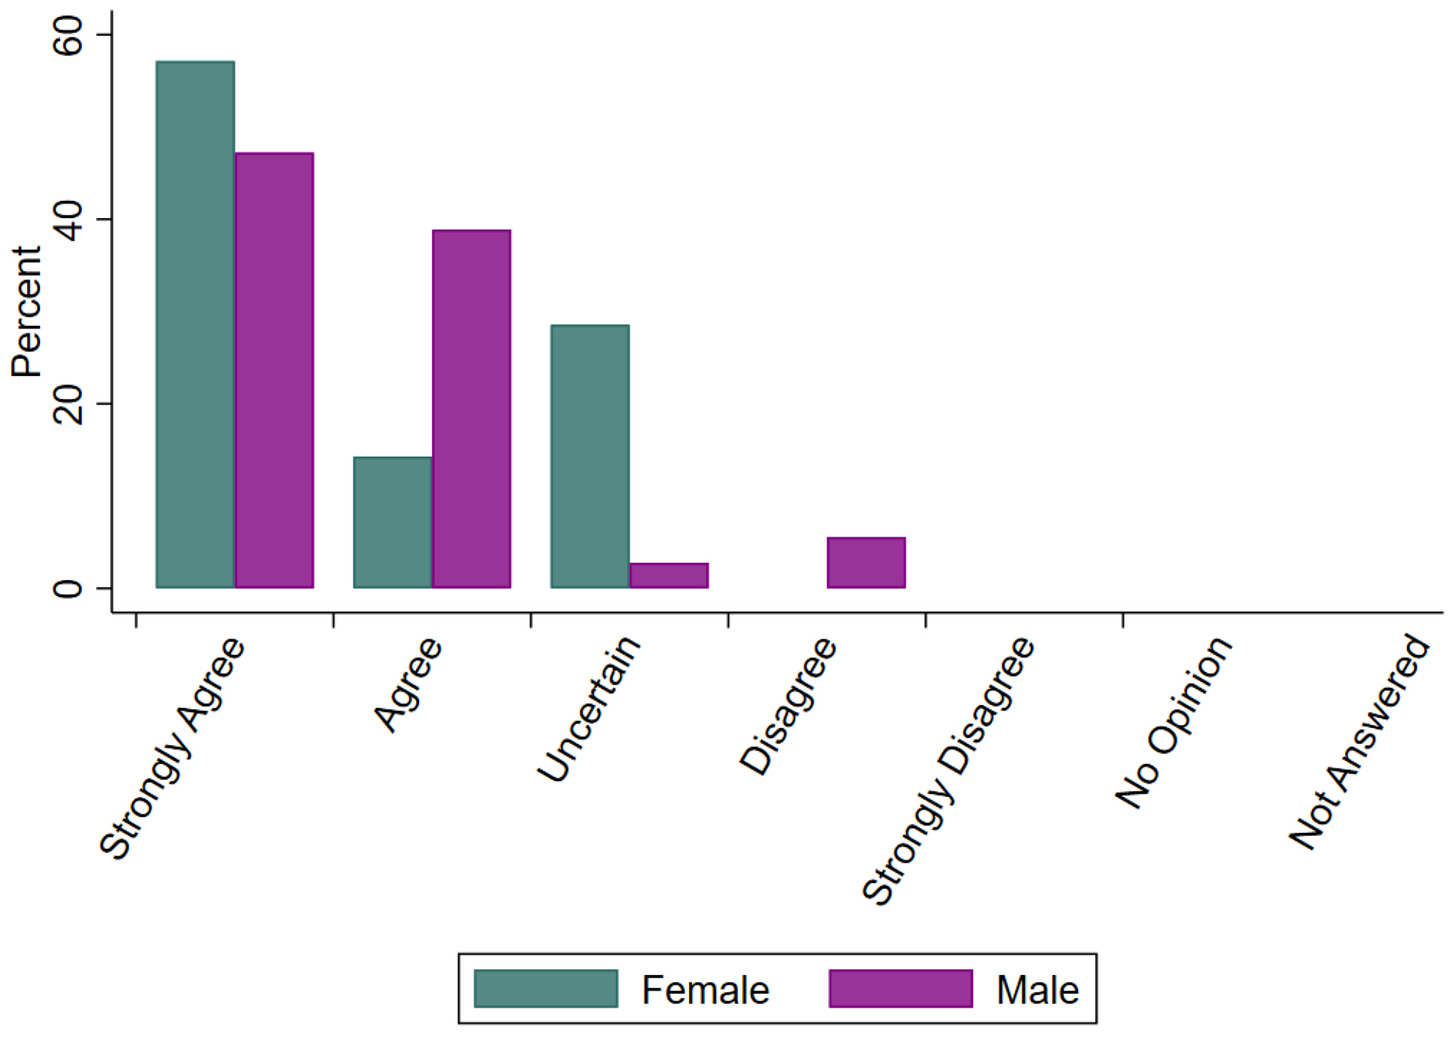
Interestingly, females more often answered uncertain, while males more often answered agree.3 Respondents in academia were almost twice as likely to strongly agree, compared to respondents in government.4
Q2 Dealing with market failures in the context of the ETS
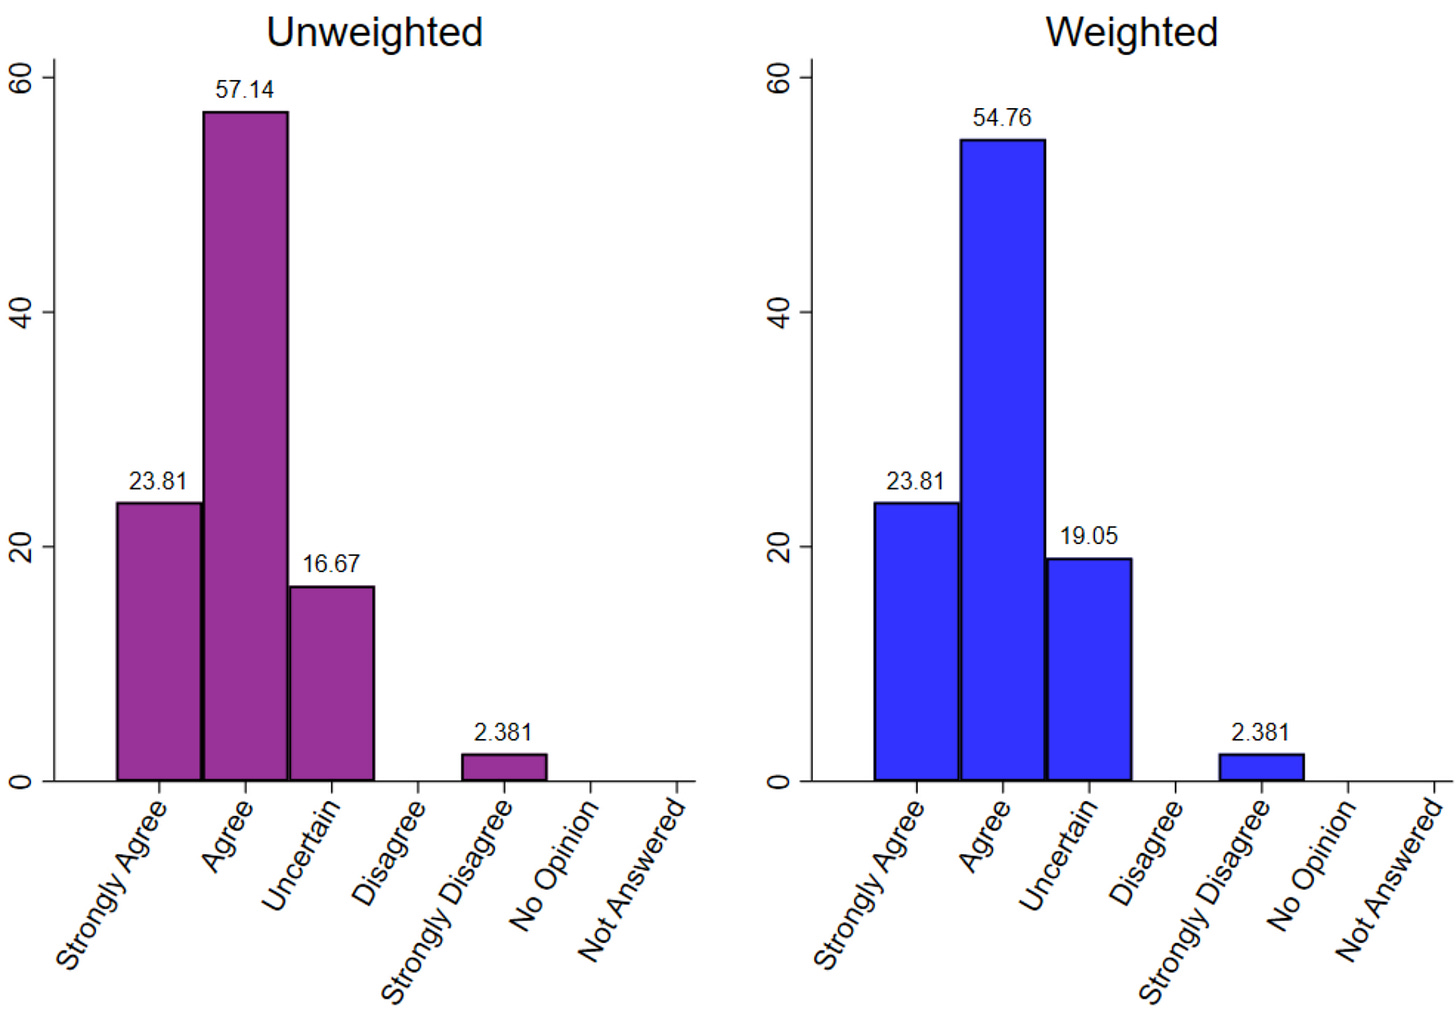
If other market failures unduly hinder adjusting to rising carbon prices, policies directly targeting those market failures may reduce the cost of mitigating emissions.
Most respondents agreed (57%) or strongly agreed (24%). Just 2% (i.e. 1 respondent) strongly disagreed, and no-one disagreed. Members’ responses were in line with those from the Expert Survey.
Compared to females, males were more likely to strongly agree, and less likely to be uncertain.5 There were only small differences between academic and government employees.
Q3 Distributional effects of the ETS
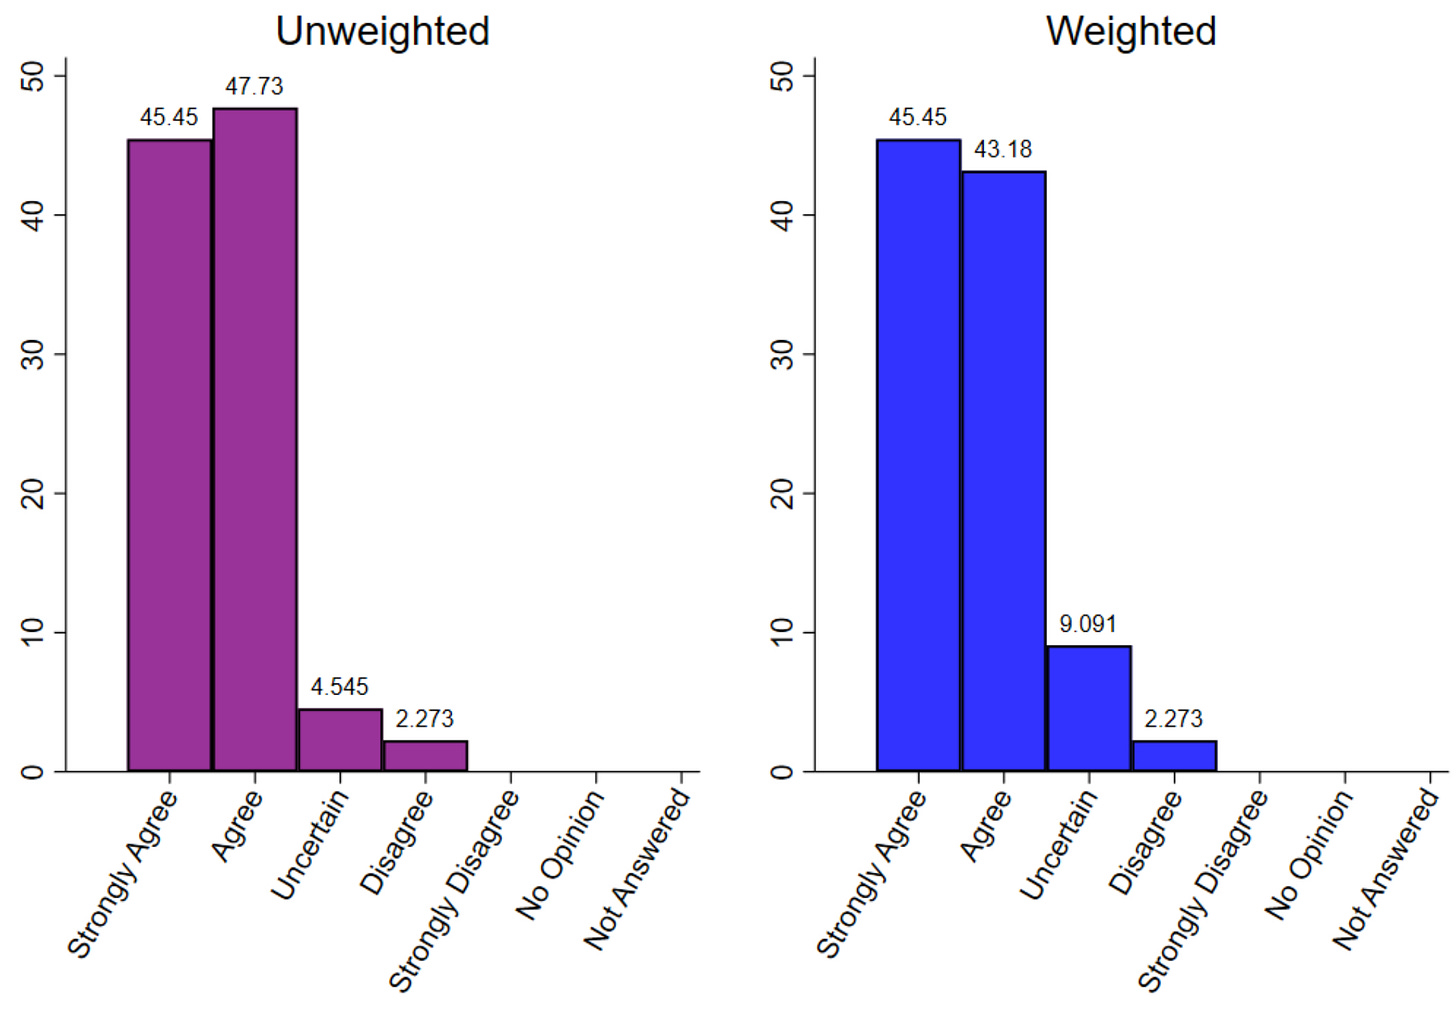
Undesirable distributional consequences of rising carbon prices are better handled through a carbon dividend that rebates government ETS revenues to households as an annual lump-sum transfer (potentially with higher transfers to lower-income households) rather than through regulatory measures requiring targeted emission reductions in sectors less likely to affect poorer households or through measures like subsidies for electric vehicles.
The vast majority of respondents agreed (48%) or strongly agreed (46%). Only 2% (1 respondent) disagreed. Members’ responses were more extreme than the expert panel, of whom 54% agreed and 13% strongly agreed.
Females and males answered Q2 similarly. Government employees all agreed or strongly agreed, while academics’ responses were more dispersed.6
To weight or not to weight?
Weighting respondent’s answers by their stated confidence in that answers made relatively little difference to the results, other than changing some agrees into uncertains.7 Answers of strongly agree and strongly disagree were unaffected. This makes sense intuitively, as an answer of strongly agree (or strongly disagree) already signals a high level of confidence. Respondents with lower confidence could be expected to choose an answer agree, disagree or uncertain.8
Knowing that answers already contain information about respondents’ confidence, I won’t report weighted results for future surveys. But I will retain the confidence scale, because I want to explore a related question: how does confidence vary by demographic group. That analysis will require pooling data across multiple surveys, because of low numbers in some groups.
Next survey coming in October November
An invitation to participate in NZAE members’ survey #4 will hit members’ inboxes in October November 2022. Look out for it!
Editor’s commentary
Firm support for the NZ ETS is, in my view, consistent with mainstream economic theory and practice. I’ll attempt — no doubt imperfectly — to summarise this perspective as:
NZ now has an efficient and effective mechanism to reach the country’s stated emissions goal (i.e. a staged reduction to zero net emissions by 2050).9
Having got a capped ETS in place, it's now best to let it work. If there are specific roadblocks, then deal with those directly, rather than taking steps that might undermine the ETS, or skew emissions reduction towards costly actions.
Cost-effectiveness matters, because the public’s support for the goal may erode should they bear unnecessarily high costs.
Changed ambition (e.g. a quicker rate of emissions reduction) is best dealt with within the ETS framework, not outside it using regulatory tools that favour particular technologies or groups of emitters.
Equity concerns are best dealt with via cash transfers.
If, as I expect, many — perhaps most — respondents agree with this summary, and the survey’s results are representative of views of NZ economists, then there is an interesting quandary. These views are substantially at odds with those of the New Zealand Climate Change Commission (CCC) and the Ministry for the Environment (MfE)— the organisations responsible for running the NZ ETS. Does the CCC and MfE know something that NZ economists don’t? Or is it they that are out of touch? A topic worthy of further exploration.
By Dave Heatley
To weight the survey responses, I first computed the mean confidence for each question. Then, for each respondent, I computed the absolute distance from the confidence mean weighted by the confidence standard deviation. If the response was above (below) the midpoint (i.e. disagree and strongly disagree) and the confidence was above mean confidence, I added (subtracted) the weighting factor. If the response was above (below) the midpoint (i.e. disagree and strongly disagree) and the confidence was below mean confidence, I subtracted (added) the weighting factor. I multiplied the calculated weighting factor by 0.49 to dampen its effect.
Relatively unusual features of the NZ ETS include a wide coverage of emissions and sinks, a hard cap on net emissions (consistent with a path to zero net emissions by 2050), and non-tradability of emissions units with other countries’ schemes.
No disagrees became uncertains as a result of weighting. This is not unexpected, as there were few disagrees to start with.
By design, the weighting scheme does not change any uncertain answer. (Indeed, I’m not really clear what it means to be have high vs. low confidence in one’s uncertainty.)
This is an oversimplification, of course. The biggest caveat is that methane emissions from agriculture are currently outside the ETS framework.






NZAE member Eric Crampton explores these issues further in his blog post: Survey says! NZAE on the ETS. See http://offsettingbehaviour.blogspot.com/2022/09/survey-says-nzae-on-ets.html