Behavioral assumptions in (macro)economics, & working from home
Reporting back on NZAE Member Survey #8
The eighth NZAE Member Survey asked questions related to behavioral assumptions in (macro)economics, and the effect of working from home on worker productivity. These questions are identical to those asked in a US expert panel survey, allowing a comparison between NZ and US economists.
Survey details
The survey was circulated amongst NZAE members on Monday 9 October 2023 and was open until Monday 16 October. Forty-six respondents answered the survey. 76% of respondents were male, and 43% held a PhD. Most respondents work in academia or in the government (63%). The 31-40 age group was best represented (26%).1
Survey results
Behavioural responses
Expectations about the future are critical in the study of economics. Absent beliefs about the future, no-one would lend, save, invest or accept money in exchange for goods and services. It follows that expectations influence behaviour, and behaviour changes when expectations are revised.
Q1. When evaluating the consequences of any shifts in economic policy regimes, it is essential to consider potential changes in the behaviour of economic agents due to revised expectations.
All respondents either agreed or strongly agreed.2 This was identical to the outcome in the US survey. The results are what I expected, given the nature of the question and the audience.
Rational expectations
Rational expectations is the economic theory that individuals learn from past trends and experiences in order to make the best possible prediction about what will happen. They could be wrong sometimes, but the theory contents that, on average, they will be correct.
Q2. The empirical evidence on how monetary policy affects the economy in the short run is most consistent with the assumption that economic agents form rational expectations.
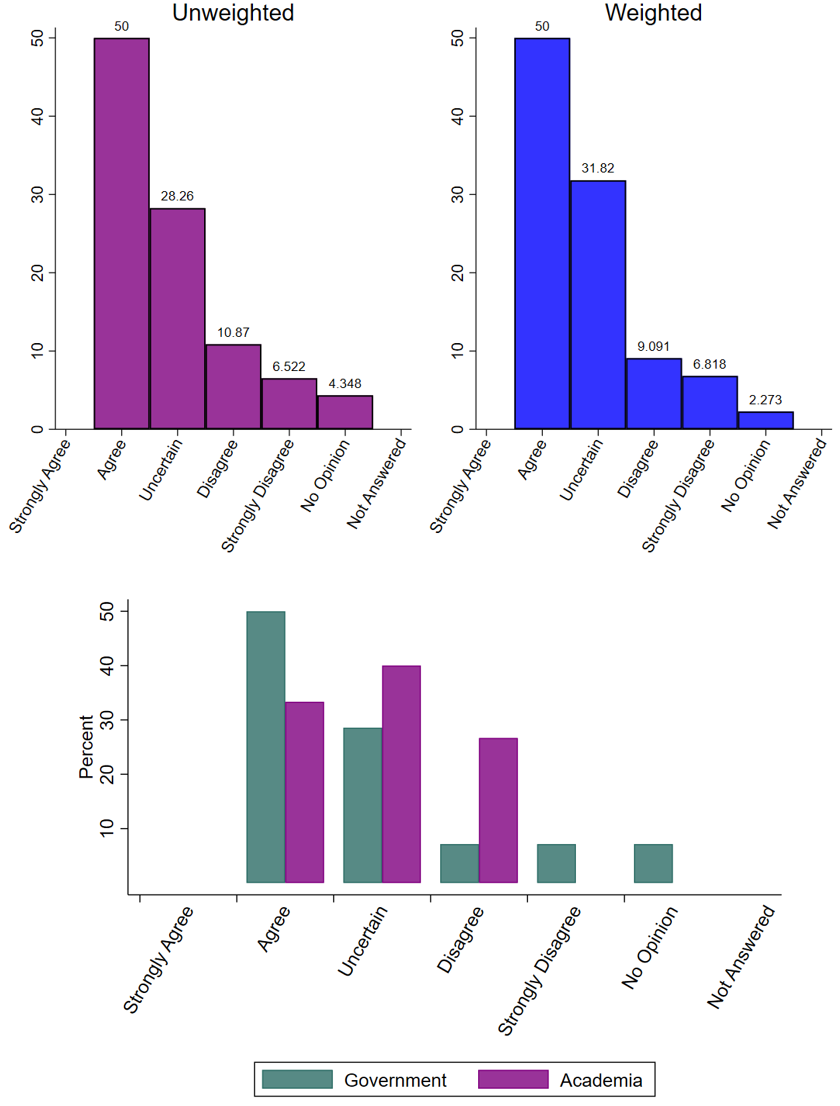
Fifty percent of respondents agreed with the statement, while 17% disagreed or strongly disagreed. Responses from the US survey were more towards disagreement with the statement, with a much higher share of “uncertain”. I found it interesting that respondents from academia were more likely to disagree compared to government economists.3
Working from home
The final, very different, question relates to working from home.
Q3. Employees who spend two of their days each week working from home are, on average, likely to be more productive over the longer term.
Fifty percent were uncertain and 20% agreed or disagreed, while 6% strongly agreed or strongly disagreed. This reproduces the results from the US survey. There was larger variation among academic economists than between government economists.4
This uncertainty reflects diverging research results. Some researchers have reported reduced productivity (e.g. “Hours worked increased, output declined slightly, and productivity fell 8%–19%”), while others reported the opposite (e.g. “On average, those who work from home … are 47% more productive”, and “non-mandatory work-from-home arrangements can have positive impacts on productivity and performance”).
I think that sitting on the fence is defensible. More research is needed on the long-run consequences of working from home to resolve this question.
Weighting
The survey also elicits the confidence in the answer to each of the three questions. This information can be used to weight the responses. I present the unweighted (raw) and weighted survey responses below.5 The results reported above are unweighted, unless otherwise specified. We found little divergence between the weighted and unweighted results for the questions in this survey.
A big thank you to the members who participate in our surveys. You can find the results from all our member surveys on the Asymmetric Information website.
Without an optimal weighting approach, we weight the survey responses as follows. We first compute the mean confidence for each question. Then, for each respondent, we compute the absolute distance from the confidence mean, weighted by the confidence standard deviation. If the response is above (below) the midpoint (i.e. disagree and strongly disagree) and the confidence is above mean confidence, we add (subtract) the weighting factor. If the response is above (below) the midpoint (i.e. disagree and strongly disagree) and the confidence is below mean confidence, we subtract (add) the weighting factor. We also multiply this weighting factor by the number 0.49 to smooth the overall weighting effect.


